Water Quality over time
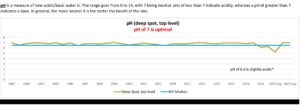
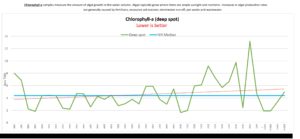
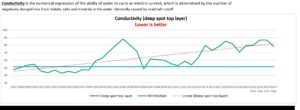
Below are some graphs of select locations water quality over time. These locations were chosen as they have been tested for many years and provide a rough indication of the water quality. In order to understand some of the technical jargon used by the DES (and we test for) it might be useful to review this document. In addition, if you would like to see the full 2022 report from the DES it is available here.


In summary, what the above tells us is that our lake quality is better in some tested areas and worse in others. Please be careful, and rereading the Lake Protection Tips as a refresher might be beneficial.